Week 1 — Hard Questions
Average rate of change, limits, and piecewise functions
Question 1 — Average Rate of Change
Let \(f(x) = 16 - x^2\text{.}\) The graph shows three secant lines, over the intervals \([0,2]\text{,}\) \([2,4]\text{,}\) and \([0,4]\text{.}\)
- Compute the average rate of change of \(f\) on each interval.
- The \([0,4]\) secant’s slope lies between the other two. Explain why that happens here.
- On which interval is \(f\) decreasing fastest? How does the graph show it?
![Graph of the downward parabola y = 16 - x^2 with points marked at (0,16), (2,12), and (4,0), and three secant lines drawn over the intervals [0,2], [2,4], and [0,4].](external/images/q1_secant_lines.svg)
Solution 1
\(f(0) = 16\text{,}\) \(f(2) = 12\text{,}\) \(f(4) = 0\)
\begin{equation*} \frac{f(2)-f(0)}{2-0} = \frac{12-16}{2} = -2 \end{equation*}\begin{equation*} \frac{f(4)-f(2)}{4-2} = \frac{0-12}{2} = -6 \end{equation*}\begin{equation*} \frac{f(4)-f(0)}{4-0} = \frac{0-16}{4} = -4 \end{equation*}On the graph, the steepest of the three secants is the \([2,4]\) line (slope \(-6\)), the shallowest is the \([0,2]\) line (slope \(-2\)), and the full-interval secant \([0,4]\) (slope \(-4\)) falls in between — match each to the correspondingly-angled labeled segment.
Question 2 — Composing Functions from a Graph
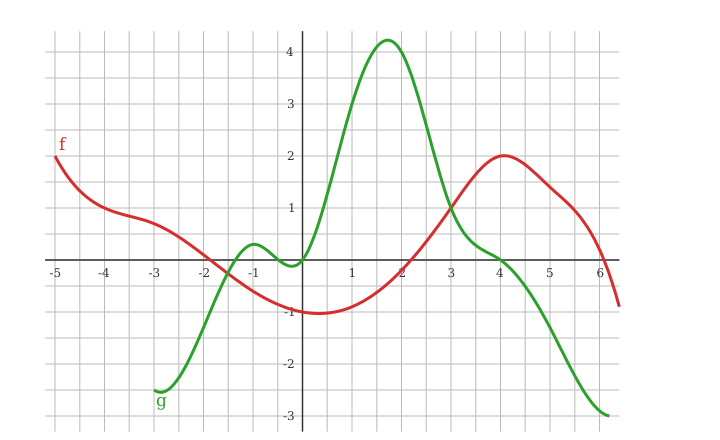
Use the graphs of \(f\) (red) and \(g\) (green) below to evaluate:
- \(\displaystyle f(3) + g(3)\)
- \(\displaystyle g(f(-4))\)
- \(\displaystyle f(g(0))\)
- \(\displaystyle g(f(4))\)
Solution
\begin{equation*} f(3) + g(3) = 1 + 1 = 2 \end{equation*}\begin{equation*} g(f(-4)) = g(1) = 3 \end{equation*}\begin{equation*} f(g(0)) = f(0) = -1 \end{equation*}\begin{equation*} g(f(4)) = g(2) = 4 \end{equation*}
Question 3 — Distance vs. Time Graph
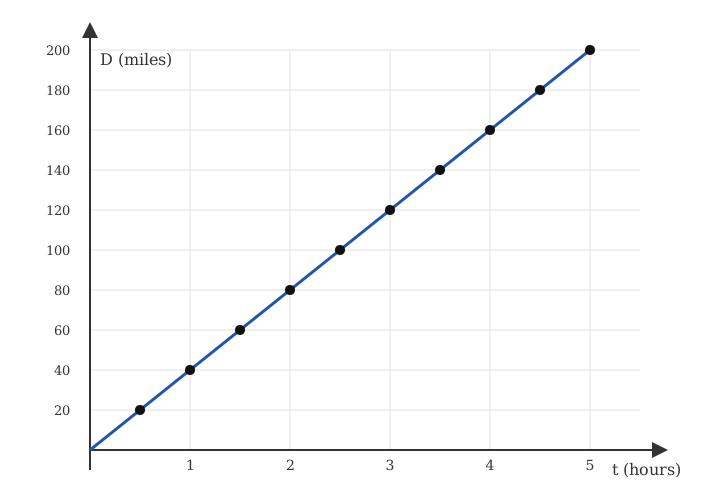
The graph shows distance \(D\) (miles) traveled versus time \(t\) (hours).
- Find \(\Delta D\) and \(\Delta t\) for \(t=1.5\) to \(t=3\text{,}\) \(t=2\) to \(t=4\text{,}\) and \(t=0.5\) to \(t=3\text{.}\)
- Explain why \(\Delta D/\Delta t\) is the same on every interval, and find its value.
- What does that constant value mean about the car’s motion?
Solution 3
Reading the line (which passes through points like \((1,40)\) and \((5,200)\text{,}\) i.e. \(D = 40t\)):
\(t{=}1.5 \to 3\text{:}\) \(\Delta D = 60\text{,}\) \(\Delta t = 1.5\text{.}\) \(t{=}2 \to 4\text{:}\) \(\Delta D = 80\text{,}\) \(\Delta t = 2\text{.}\) \(t{=}0.5 \to 3\text{:}\) \(\Delta D = 100\text{,}\) \(\Delta t = 2.5\text{.}\)
Each ratio gives \(\Delta D/\Delta t = 40\) mi/hr — constant because the graph is a straight line, and a line’s average rate of change is the same over every interval (it equals the slope).
Correct interpretations: C (it is the slope of the line) and E (it represents the car’s velocity). The others describe things this number is not — e.g. it is not the total distance traveled, not an acceleration, and not specific to only the first two hours.
Question 4 — Comparing Rates of Change on Two Graphs
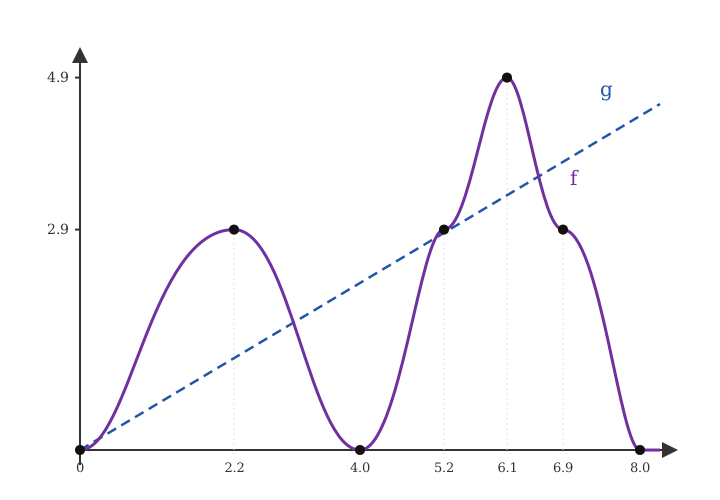
The graph shows a curve \(f(x)\) and a straight dashed line \(g(x)\text{.}\) They meet at \(x=0\text{,}\) \(x=2.2\text{,}\) and \(x=5.2\text{.}\)
- On \([0,8]\text{,}\) which has the greater average rate of change, \(f\) or \(g\text{?}\) Why?
- On \([5.2, 6.1]\text{,}\) which is greater? Point to what on the graph tells you.
- Give an interval where \(f\)’s average rate of change is negative, and one where it is zero.
Solution 4
1. On \([0,8]\text{,}\) \(f\) starts and ends at \(0\text{,}\) so its average rate of change is \(0\text{.}\) The line \(g\) rises from \(0\) up to a positive value, so its average rate is positive. g is greater.
2. On \([5.2, 6.1]\text{,}\) \(f\) climbs steeply from \(2.9\) to its peak \(4.9\text{,}\) while \(g\) rises only gently over the same span. The steeper segment is \(f\)’s, so f is greater — you can see it in the graph as the sharper upward tilt of the curve versus the dashed line.
3. Negative: on \([2.2, 4.0]\text{,}\) \(f\) falls from \(2.9\) to \(0\text{,}\) so its average rate of change is negative. Zero: on \([2.2, 6.9]\text{,}\) \(f(2.2) = f(6.9) = 2.9\text{,}\) so the net change is \(0\) and the average rate of change is zero. (Other valid answers exist — e.g. \([0,4]\) also gives zero.)
Question 5 — Limits from a Graph
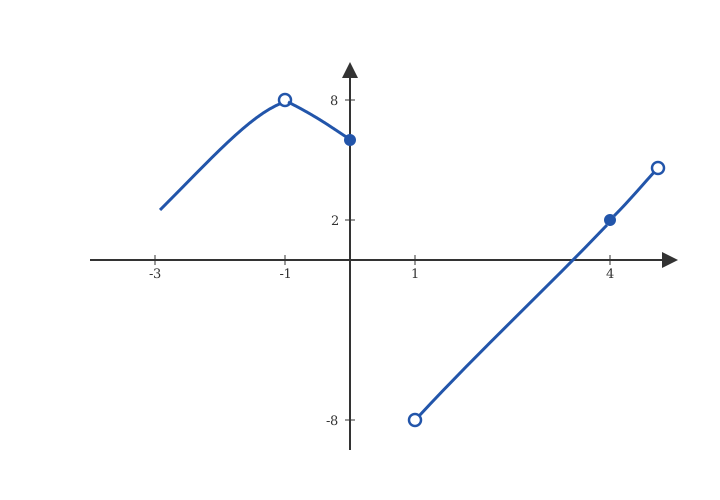
The graph below shows a function \(f(x)\) with a jump discontinuity at \(x=1\text{.}\)
For each, give the limit, or state that it does not exist and explain why.
- \(\displaystyle \displaystyle\lim_{x \to -1} f(x)\)
- \(\displaystyle \displaystyle\lim_{x \to 0} f(x)\)
- \(\displaystyle \displaystyle\lim_{x \to 1} f(x)\)
- \(\displaystyle \displaystyle\lim_{x \to 4} f(x)\)
Solution 5
(a) \(\lim_{x\to -1} f(x) = 8\) — the curve approaches the open circle at \(y=8\) from both sides (the limit doesn’t care that the function may not equal 8 there).
(b) \(\lim_{x\to 0} f(x) = 6\) — the curve is continuous through the solid dot at \(x=0\text{.}\)
(c) \(\lim_{x\to 1} f(x) =\) none — the graph jumps here (open circle low on one side, a different branch on the other), so the left- and right-hand limits disagree.
(d) \(\lim_{x\to 4} f(x) = 2\) — both branches approach the same height at \(x=4\text{,}\) even though the function value there (solid dot) may differ slightly from that height.
Question 6 — Piecewise Function Limits
For the function
Use algebra to find:
- \(\displaystyle \lim_{x\to 4^+} f(x)\)
- \(\displaystyle \lim_{x\to 4^-} f(x)\)
- \(\displaystyle \lim_{x\to 4} f(x)\)
(enter DNE if a limit does not exist).
Solution 6
From the left, use \(2x-3\text{:}\)
\begin{equation*} \lim_{x\to 4^-} f(x) = 2(4) - 3 = 5 \end{equation*}From the right, use \(x^2 - 8x + 21\text{:}\)
\begin{equation*} \lim_{x\to 4^+} f(x) = 16 - 32 + 21 = 5 \end{equation*}Since the one-sided limits agree (both equal \(5\)),
\begin{equation*} \lim_{x\to 4} f(x) = 5 \end{equation*}Note this differs from \(f(4) = -1\) — the limit describes where the graph is heading, not the function’s actual (separately defined) value at \(x=4\text{.}\)
Question 7 — Limit Requiring Algebraic Simplification
Evaluate the limit:
If the limit does not exist, enter DNE.
Solution 7
Factor \(x^2 - 9 = (x-3)(x+3)\text{,}\) so the second term simplifies (for \(x \ne 3\)):
\begin{equation*} \frac{x-3}{x^2-9} = \frac{x-3}{(x-3)(x+3)} = \frac{1}{x+3} \end{equation*}So the whole expression becomes
\begin{equation*} \frac{1}{x+3} + \frac{1}{x+3} = \frac{2}{x+3} \end{equation*}which is continuous at \(x=3\text{,}\) so we substitute directly:
\begin{equation*} \lim_{x\to 3} \frac{2}{x+3} = \frac{2}{6} = \frac{1}{3} \end{equation*}
Question 8 — Difference Quotient with Absolute Value
Let
Find
Solution 8
Since \(\alpha > 0\text{,}\) we have \(\alpha + 6 > 0\text{,}\) and for \(h\) near \(0\text{,}\) \(\alpha + h + 6 > 0\) as well — so both inputs stay in the region where \(x+6 > 0\) and \(|x+6| = x+6\text{.}\) There, \(g(x) = 1\) identically.
So \(g(\alpha+h) = 1\) and \(g(\alpha) = 1\) for all such \(h\text{,}\) giving
\begin{equation*} \frac{g(\alpha+h) - g(\alpha)}{h} = \frac{1-1}{h} = 0 \end{equation*}for every \(h \ne 0\) small enough to stay in that region, so
\begin{equation*} \lim_{h\to 0} \frac{g(\alpha+h)-g(\alpha)}{h} = 0 \end{equation*}This matches the fact that \(g\) is locally constant (\(g\equiv 1\)) near any \(\alpha > 0\text{,}\) so its rate of change there is \(0\text{.}\)